
Listen to this Post
Introduction
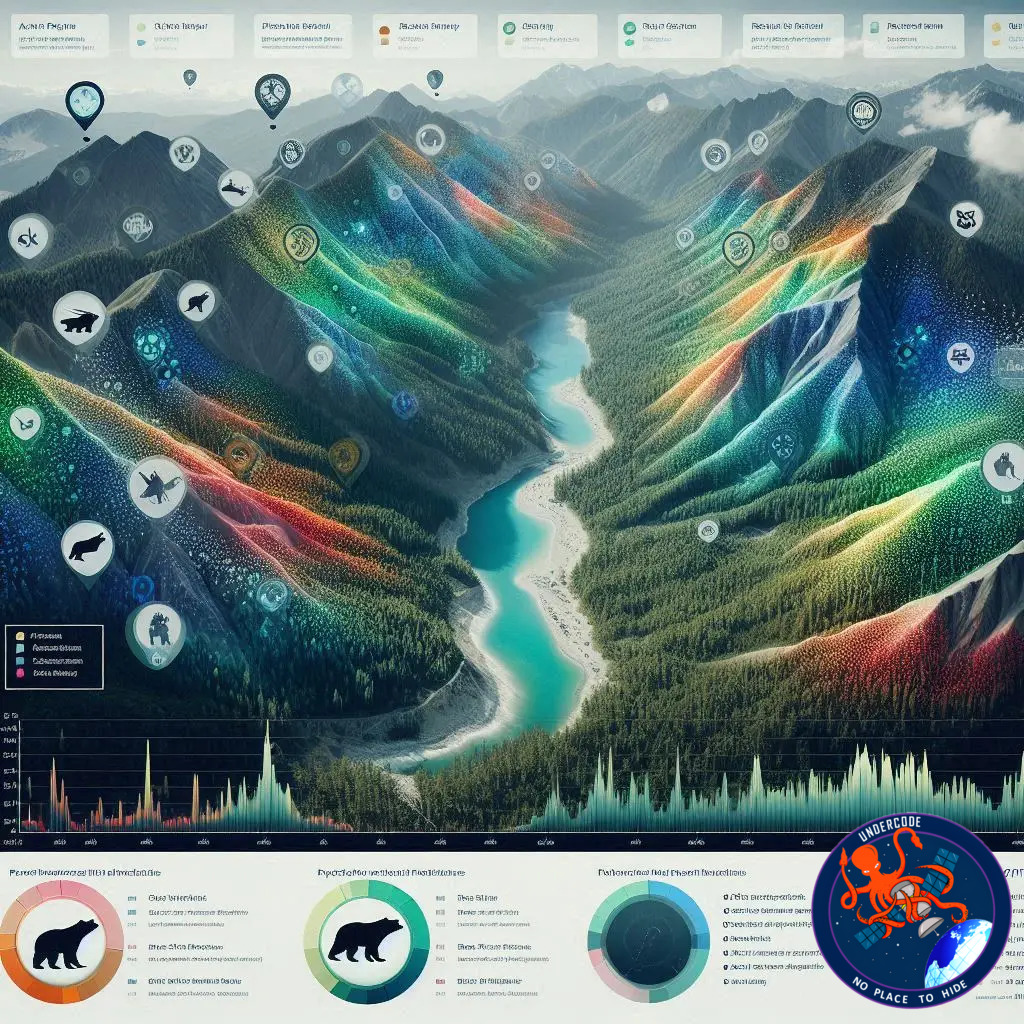
As bear-related incidents surge across Japan, a team at Sophia University in Tokyo has launched a pioneering AI-based tool to forecast where human–bear encounters are most likely to occur. By leveraging open data and environmental variables, their “Bear Encounter AI Prediction Map” visualizes risk on a granular geographical scale, helping both authorities and local residents identify and prepare for danger zones.
the Original
Associate Professor Yusuke Fukazawa and his research team at Sophia University developed an AI model to estimate the probability of bear encounters in Japan. They segment regions into 1‑kilometer square grids, and each cell is colored on a five‑level scale: from “Low” to “Very High” risk. The deeper the color, the greater the predicted likelihood of a bear being present.
Their system uses open data, including municipal records of past bear sightings, environmental features, and ecological indicators like the abundance of acorns (a key food source for bears). By analyzing these variables, the AI identifies hotspots where encounters are more probable.
The map covers 19 regions, including Tokyo, Akita Prefecture, and Sapporo, among others. It reveals that certain high-risk areas are often located around mountain foothills, along river corridors, and remote valley roads — places where bears can roam more freely. Aging communities in rural zones also face elevated risk, according to the researchers.
A News
+2
The Straits Times
+2
According to reports, Japan is experiencing a worrying increase in bear attacks, with 13 fatalities recorded between April and November 5 this year.
A News
To communicate risk effectively, the map translates the AI’s probability scores into categories: “Very High” corresponds to an 80–100% risk, while “Low” is around 0–20%.
Fukazawa Lab
+1
Sophia University’s lab is transparent about the tool’s purpose: it is not a crystal-ball predictor, but a warning system. They urge users to combine the map with official updates from local governments and real-time reports when making decisions.
上智大学 | 応用データサイエンス 学位プログラム
+1
What Undercode Says: Analysis & Insight
The development of this AI-driven bear-encounter map is a compelling example of how data science can serve public safety in a very concrete, real-world way. Rather than being an abstract research project, it’s a practical tool that directly addresses a growing societal problem — human–bear conflict — which is increasingly severe in many rural and semi-rural parts of Japan.
1. Bridging Ecology & Technology
What’s striking is how the research integrates ecological data (like acorn abundance) with human-centric variables (population density, road networks). This synthesis is powerful: AI doesn’t just predict based on where bears have been, but also on where they could be, given food supply and movement corridors. It’s a holistic risk model that respects both wildlife behavior and human geography.
2. Granularity Matters
By dividing the map into 1 km² grids, the researchers provide high spatial resolution. This allows for fine-grained risk differentiation — not just “this prefecture is dangerous,” but “this particular patch of land has a 60–80% predicted risk.” That granularity can guide individual decisions (like alternate hiking routes) and policy interventions (such as placing warning signs or allocating patrolling resources).
3. Transparency and Ethical Use
Sophia University is careful to frame the tool responsibly. They emphasize that the map is for awareness and caution, not absolute prediction. This is critical: overconfidence in such tools could lead to complacency or, worse, misuse. By encouraging cross-referencing with real-time, official data, they safeguard against blind reliance on AI.
4. Vulnerable Communities
The finding that aging or depopulated communities face higher risk is socially meaningful. These areas may already lack adequate emergency or wildlife management infrastructure. The tool could help prioritize outreach, education, or preventive measures in these communities — social equity is clearly part of the research’s potential impact.
5. Scalability & Future Directions
The project currently covers 19 regions, but the method is scalable. As more data becomes available (weather, bear movement, newer sighting reports), the model can be refined. There’s also room to incorporate predictive feedback loops: if certain “Very High” zones actually see no bear sightings over time, the model can adjust its weightings.
Fukazawa’s team might even explore integrating real-time sensors (like wildlife cameras) to further validate and update predictions dynamically. Over time, such a feedback system could transform the map from a one-off risk estimator into a continuously learning platform.
6. Policy Implications
For local governments and disaster-prevention bodies, this map is a strategic asset. It can inform zoning decisions, emergency planning, and resource allocation. For example, municipalities could deploy bear deterrence measures more proactively in high-risk grid cells: signage, community alerts, or preventive education campaigns.
7. Public Engagement and Trust
Finally, for such a tool to have real-world effect, the public needs to trust it. Sophia University’s choice to make the map publicly accessible is smart — transparency helps. But they also need to invest in outreach, explaining how to interpret the map, its limitations, and how people should act. Risk communication is not just about data; it’s about empowering real people.
Fact Checker Results
✅ The bear prediction map was developed by Associate Professor Yusuke Fukazawa’s lab at Sophia University.
上智大学 | 応用データサイエンス 学位プログラム
✅ The map divides regions into five risk levels using AI predictions based on environmental and sighting data.
A News
+2
Fukazawa Lab
+2
✅ The purpose of the map is clearly stated as caution and awareness, not guaranteed prediction; users are advised to cross-reference with local info.
上智大学 | 応用データサイエンス 学位プログラム
Prediction
Looking ahead, I predict that this AI-based bear‑encounter risk map will become a cornerstone of wildlife risk management in Japan. Over the next few years, we could see:
Expanded Coverage: The model could be deployed to all Japanese prefectures with bear populations, providing a nationwide risk atlas.
Real-time Integration: The system may incorporate live data — from trail cameras, weather sensors, or citizen-reported sightings — enabling near real-time adjustment of risk levels.
Policy Adoption: Local governments will likely use the map to guide prevention strategies, such as placing warning systems, educating residents, or even influencing infrastructure decisions (like where to limit development).
Community Engagement: The researchers may launch public campaigns or apps that let citizens check their area’s risk, report sightings, and receive alerts, fostering a proactive “bear-aware” culture.
In the long run, this approach could serve as a template for AI-assisted wildlife coexistence models — not just for bears in Japan, but for human–wildlife interaction challenges around the world.
🕵️📝✔️Let’s dive deep and fact‑check.
References:
Reported By: xtechnikkeicom_3ca4dab49b7551aeedb76f93
Extra Source Hub (Possible Sources for article):
https://www.quora.com
Wikipedia
OpenAi & Undercode AI
Image Source:
Unsplash
Undercode AI DI v2
Bing
🔐JOIN OUR CYBER WORLD [ CVE News • HackMonitor • UndercodeNews ]
📢 Follow UndercodeNews & Stay Tuned:
𝕏 formerly Twitter 🐦 | @ Threads | 🔗 Linkedin | 🦋BlueSky | 🐘Mastodon


