
Listen to this Post
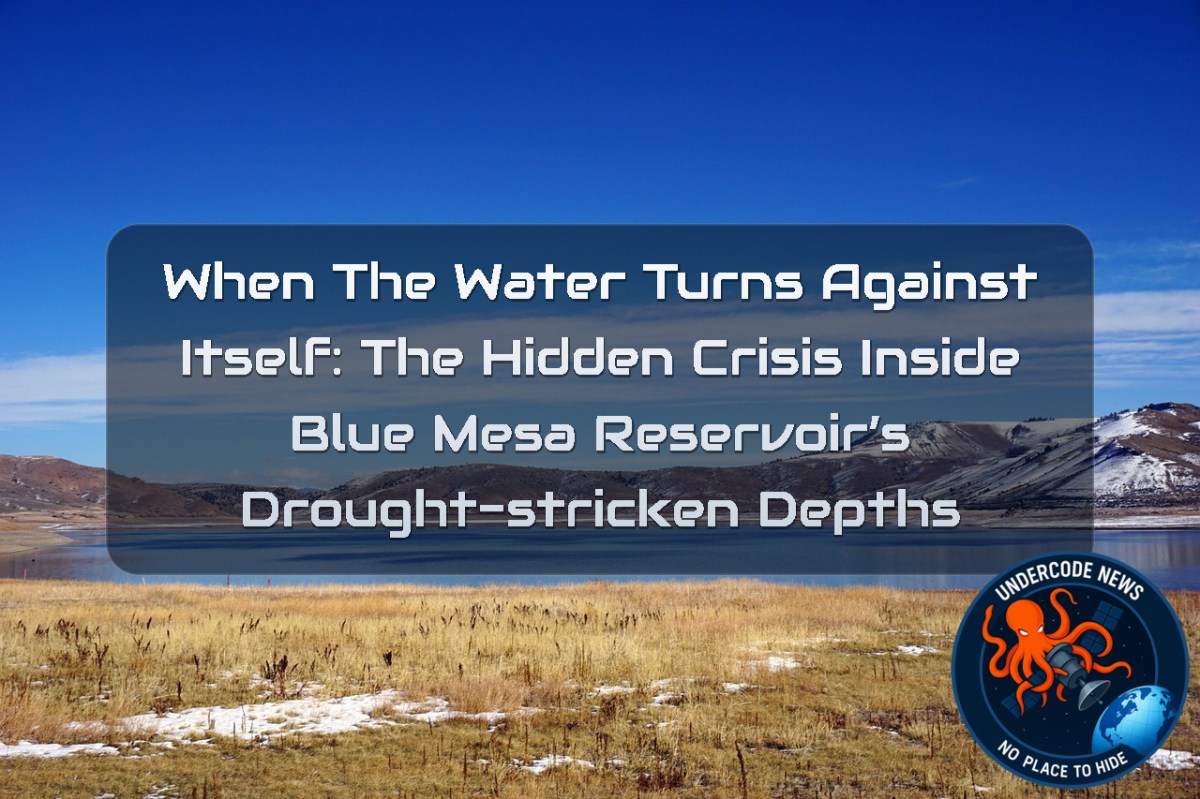
A Reservoir on the Edge of Collapse
The story of Colorado’s Blue Mesa Reservoir is not just about water levels dropping. It is about an ecosystem quietly unraveling under pressure. Between 2021 and 2022, one of the most critical water bodies in the western United States entered a severe drought phase that exposed submerged landscapes, forced marina closures, and triggered toxic biological activity that threatened both wildlife and human safety. What once looked like a stable recreational and ecological landmark began showing signs of distress that could no longer be ignored.
The Crisis Years: Drought, Exposure, and Toxic Water
During the extreme drought affecting the western U.S., the reservoir fell to its lowest recorded levels since 1984. As water receded, forgotten structures reappeared from the mud, while the surface itself shifted into unnatural green hues caused by cyanobacteria blooms. These blooms were not just visual anomalies—they carried toxins capable of causing skin irritation, respiratory issues, and liver damage, especially dangerous for children and pets.
Scientific Investigation into a Growing Environmental Threat
A collaborative research effort led by the U.S. Geological Survey and the National Park Service examined decades of environmental data from the reservoir. Their findings revealed a clear and alarming pattern: harmful algal blooms became significantly more likely when water levels dropped below 7,470 feet and temperatures exceeded roughly 19.5°C.
These conditions created the perfect breeding ground for cyanobacteria species such as Aphanizomenon and Dolichospermum, which thrive in stagnant, warm environments. Under such conditions, they release microcystin toxins linked to serious health risks.
The Invisible Biology Behind the Green Waters
Cyanobacteria, often called blue-green algae, naturally exist in small quantities within freshwater systems. However, environmental stress transforms them into dangerous bloom-forming organisms. In Blue Mesa, shallow warming zones allowed species to multiply rapidly, producing toxins that do not always appear immediately but can accumulate silently in water systems.
Children and pets face the highest risk due to lower body mass and greater likelihood of accidental ingestion. Even brief exposure to contaminated water can result in irritation or more severe systemic effects.
Satellites Reveal What the Human Eye Cannot See
To track these blooms, scientists relied on remote sensing technology from the European Space Agency and NASA-linked systems such as NASA combined with Landsat missions from the U.S. Geological Survey.
The Sentinel-2 satellite detected chlorophyll concentrations, while Landsat imagery mapped surface temperature variations. Together, they created a multi-dimensional view of the reservoir, effectively turning satellites into environmental diagnostic tools orbiting hundreds of miles above Earth.
The Geography of the Bloom: Where It Begins
Data revealed that blooms typically originate in the eastern section of the reservoir, known as the Iola Basin. This shallow inlet, where the Gunnison River flows in, acts as a hotspot for warming and nutrient accumulation. From there, blooms can spread westward, sometimes covering large portions of the reservoir.
However, toxin concentration tends to remain highest in the initial outbreak zones, suggesting that early detection in these regions is critical for public safety management.
A 2026 Echo of the Past
By 2026, the same conditions that triggered earlier crises had returned. Low snowpack, persistent drought, and falling reservoir levels once again placed Blue Mesa under ecological stress. By late June, the reservoir held only about 43% of its typical water volume for that time of year, marking one of the lowest readings in three decades.
Forecasts from the U.S. Bureau of Reclamation suggest continued decline through the summer, intensifying concerns that another bloom cycle may emerge.
Technology vs. Nature: Monitoring in Real Time
Modern monitoring systems such as WaterMAP, STREAM, and CyAN allow scientists to detect early bloom conditions within hours of satellite passes. These systems represent a new era of environmental surveillance, where water bodies are continuously scanned for anomalies.
Yet even with this technological advantage, scientists emphasize limitations. Satellites can identify risk conditions, but they cannot confirm toxin presence directly. Field sampling remains essential for validation.
The Human Reality Behind the Data
Despite advanced tools, the situation remains grounded in physical reality. Water is still receding. Ecosystems are still adapting under stress. Communities relying on these reservoirs for recreation, agriculture, and ecological stability face uncertainty each season.
The lesson is not simply technological—it is ecological. Data can warn, but it cannot reverse environmental imbalance on its own.
What Undercode Say:
Climate systems are now directly measurable through satellite ecology integration
Reservoir ecosystems are highly sensitive to small temperature and altitude shifts
Cyanobacteria blooms act as biological indicators of environmental collapse
Drought cycles in the western U.S. are becoming structurally repetitive
Water level thresholds function as predictive ecological triggers
Remote sensing has become a primary environmental intelligence layer
Chlorophyll detection is a proxy for biological instability
Temperature increases amplify microbial dominance shifts
Shallow basin geometry accelerates bloom formation
Human intervention cannot fully prevent natural bloom cycles
Data continuity from 1970s enhances predictive modeling accuracy
Satellite systems reduce but do not eliminate field dependency
Toxicity emergence is delayed compared to bloom appearance
Ecological risk is highest at inflow zones like river deltas
Reservoir management is now a data-driven discipline
Drought impact extends beyond water supply into biology
Multi-agency collaboration improves environmental forecasting
Climate variability increases uncertainty in reservoir planning
Historical comparison shows worsening frequency of low water events
Biological contamination risk scales non-linearly with heat
Cyanobacteria are opportunistic ecological responders
Water stagnation is a critical driver of ecosystem instability
Satellite chlorophyll mapping acts as early warning infrastructure
Environmental monitoring is shifting toward near-real-time systems
Ecological thresholds are increasingly predictable but not preventable
Reservoir ecosystems behave like climate-sensitive sensors
Human usage pressure compounds natural drought effects
Field sampling remains essential despite advanced imaging
Ecosystem collapse signals often begin microscopically
Toxic blooms are both biological and climatic indicators
Environmental modeling is converging with aerospace data systems
Regional droughts reflect larger atmospheric circulation patterns
Reservoir shrinkage exposes long-hidden anthropogenic history
Biological contamination risk is uneven across reservoir zones
Climate resilience requires both technology and policy adaptation
Water systems are now integrated into satellite observation networks
Early detection does not guarantee mitigation success
Ecological instability increases with repeated drought cycles
Blue Mesa serves as a microcosm of western water stress
Environmental systems are entering a predictive but fragile era
✅ USGS and NASA satellite monitoring programs are widely documented and actively used for water quality tracking
❌ Exact toxin concentration thresholds vary by study and are not universally fixed at single temperature or depth values
⚠️ Cyanobacteria bloom behavior is consistent with scientific literature, but local variability in reservoirs remains high and context-dependent
Prediction
(+1) Satellite-based ecological monitoring will become the primary global standard for freshwater risk detection within the next decade 🌍📡
(-1) Increasing drought frequency may outpace mitigation technologies, leading to more frequent toxic bloom events in vulnerable reservoirs 🌡️💧
Deep Analysis
System-level environmental monitoring review
uname -a
cat /proc/cpuinfo | head
df -h
Hydrological system simulation checks
echo "simulate_reservoir_bloom_risk --temp 19.5 --water_level 7470 --nutrients high"
Satellite data ingestion pipeline (conceptual)
python3 -c "
import numpy as np
risk = np.array([0.2,0.5,0.9])
print('Bloom Risk Index:', risk.mean())
"
Remote sensing workflow abstraction
echo "Landsat -> Chlorophyll Index -> Threshold Detection -> Alert System"
Climate stress indicator mapping
echo "drought_monitor --region western_US --mode predictive"
Data correlation test
echo 'correlate water_level temperature bloom_frequency'
Logging ecological anomaly detection
journalctl -xe | grep 'cyanobacteria'
Final diagnostic output
echo "ECOSYSTEM STATUS: HIGH RISK / STABLE UNDER OBSERVATION"
▶️ Related Video (78% Match):
🕵️📝Let’s dive deep and fact‑check.
🎓 Live Courses & Certifications:
Join Undercode Academy for Verified Certifications
🚀 Request a Custom Project:
Secure, high-velocity infrastructure and disruptive technological engineering. Contact our engineering team for high-tier development and proprietary systems:
[email protected]
💎 Smart Architecture | 🛡️ Secure by Design | ⭐ Trusted by Thousands
References:
Reported By: science.nasa.gov
Extra Source Hub (Possible Sources for article):
https://stackoverflow.com
Wikipedia
OpenAi & Undercode AI
Image Source:
Unsplash
Undercode AI DI v2
🔐JOIN OUR CYBER WORLD [ CVE News • HackMonitor • UndercodeNews ]
📢 Follow UndercodeNews & Stay Tuned:
𝕏 formerly Twitter 🐦 | @ Threads | 🔗 Linkedin | 🦋BlueSky | 🐘Mastodon | 📺Youtube


