
Listen to this Post
Introduction: A Major Step Forward in GitHub Repository Governance
GitHub continues to refine how developers and enterprises manage repository security, compliance, and operational visibility. The latest update introduces a redesigned Rule Insights Dashboard along with a Unified Filter Bar across multiple alert management pages. These enhancements are aimed at simplifying how teams observe rule evaluation activity, track bypass behavior, and investigate security-related alerts across repositories and organizations. Previously, extracting meaningful patterns from rule evaluations required manual digging through logs and scattered data views, making incident response and auditing slower and more complex. With this update, GitHub brings a more intuitive, visual-first approach that improves transparency, reduces friction, and strengthens decision-making for security and DevOps teams. The result is a more cohesive experience that aligns rule evaluation insights and alert management into a consistent, centralized interface designed for speed, clarity, and scalability.
Comprehensive the Update and Its Core Features
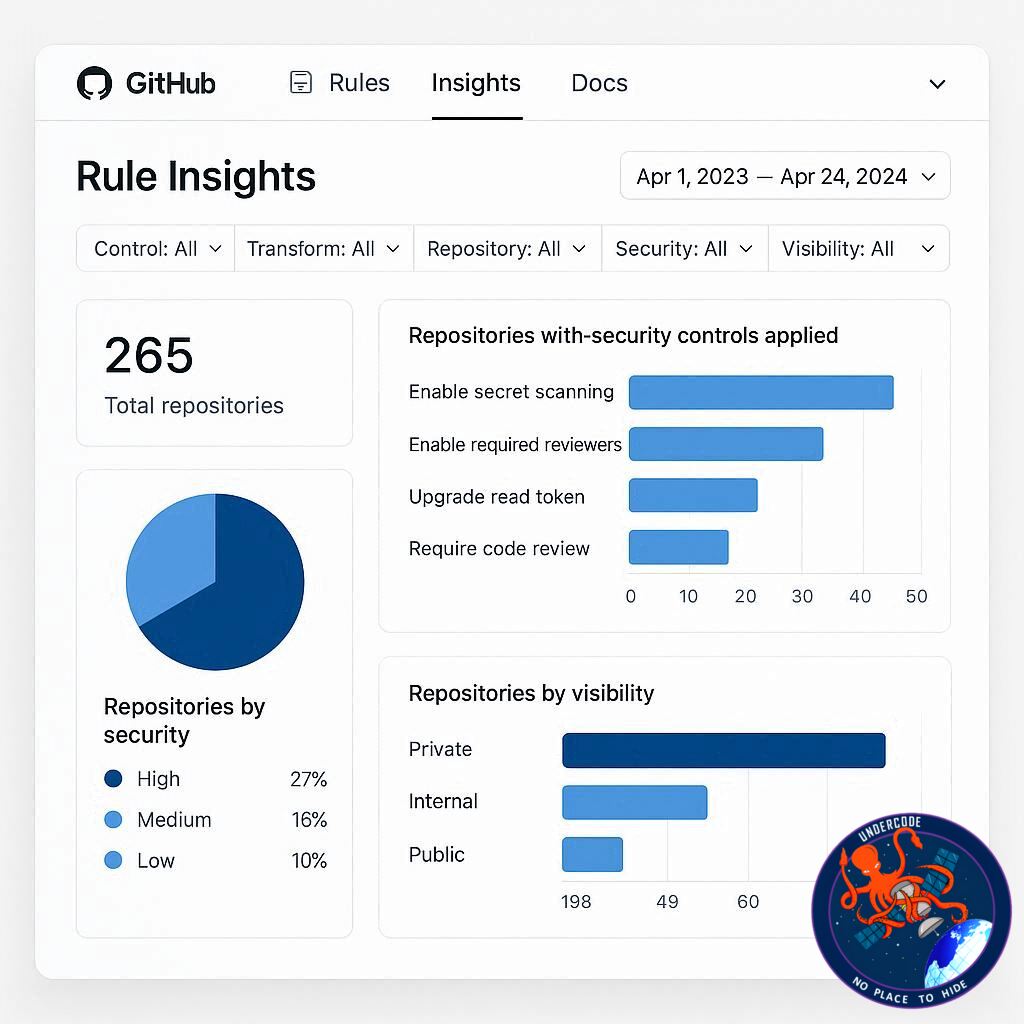
The new Rule Insights Dashboard is now integrated into the Settings section of GitHub repositories under the Rules tab, offering a high-level visual representation of rule evaluation activity. Instead of manually filtering through raw logs, users can now instantly view trends such as successes, failures, and bypasses over time. This allows teams to quickly understand how repository rulesets are performing in real-world usage. One of the most important additions is the ability to identify the most active bypassers, helping security teams detect patterns of rule circumvention that could indicate risky behavior or operational bottlenecks. Each visualization in the dashboard is interactive and linked directly back to the Rule Insights page, where filters are pre-applied based on the selected chart element. This enables seamless navigation from high-level trends to granular investigation without losing context. The dashboard is particularly useful during incident response scenarios, where identifying spikes in blocked pushes or unusual bypass activity is critical. It also supports long-term auditing by making behavioral trends more visible and easier to interpret. Alongside this, GitHub has introduced a Unified Filter Bar across several alert management interfaces, replacing older custom dropdown-based filtering systems. This update impacts multiple areas, including code scanning alert dismissal requests, Dependabot alert dismissal requests, secret scanning alert dismissals, and secret scanning push protection bypass requests across enterprise, organization, and repository levels. The unified filter system standardizes how users interact with alert data, ensuring consistency across different security tools. It also introduces support for custom properties, allowing more advanced filtering and segmentation of alerts based on user-defined metadata. This change significantly improves usability for security engineers and platform administrators who previously had to adapt to inconsistent filtering patterns across different pages. By consolidating filtering behavior, GitHub reduces cognitive load and improves operational efficiency. Both the Rule Insights Dashboard and the Unified Filter Bar are currently available in public preview, signaling an ongoing effort by GitHub to modernize its security and governance experience while collecting user feedback before full release.
What Undercode Say: Strategic Impact of GitHub’s Observability and Filtering Evolution
GitHub’s introduction of the Rule Insights Dashboard represents more than a visual upgrade. It reflects a deeper shift toward observability in software governance. Modern DevOps pipelines rely heavily on policy enforcement through rulesets, but without visibility, enforcement becomes reactive instead of proactive. This dashboard addresses that gap by turning abstract rule evaluation data into actionable insights.
From a security engineering perspective, the ability to track successes, failures, and bypasses over time creates a behavioral fingerprint of repository activity. This makes anomaly detection significantly more practical. Sudden spikes in bypass attempts may indicate either misconfigured rules or malicious activity, both of which require immediate attention. The dashboard essentially transforms passive logs into an active monitoring system.
The inclusion of “most active bypassers” introduces a controversial but powerful accountability mechanism. While useful for security auditing, it may also raise concerns about developer surveillance in larger organizations. However, in regulated environments, this visibility is critical for compliance and risk management.
The unified filter bar is equally important from a systems design standpoint. In large platforms, inconsistency in UI patterns leads to increased cognitive overhead. Engineers waste time relearning filtering behavior across different tools such as code scanning, secret scanning, and Dependabot alerts. By standardizing this component, GitHub is reducing interface fragmentation and improving operational flow.
Another key implication is scalability. As organizations grow, alert volume increases dramatically. Without consistent filtering, triaging alerts becomes inefficient. The unified filter bar allows teams to apply structured queries across multiple security domains, improving cross-system analysis.
The addition of custom property filtering is particularly significant. It enables organizations to define their own metadata layers and use them for segmentation. This brings GitHub closer to being a fully customizable security observability platform rather than just a version control system with security extensions.
From a DevSecOps maturity perspective, these updates align with industry trends toward integrated security dashboards, similar to SIEM systems. Instead of exporting data to external tools, teams can now perform meaningful analysis directly within GitHub.
Incident response workflows also benefit heavily. During active incidents, time-to-insight is critical. The ability to click directly from a chart into a filtered dataset reduces investigation time and improves decision accuracy. This tight coupling between visualization and data exploration is a hallmark of modern observability platforms.
The public preview status indicates that GitHub is still collecting feedback, likely refining performance, usability, and edge-case behavior. It also suggests future expansion, potentially integrating predictive analytics or automated anomaly detection in rule evaluations.
Overall, this update signals GitHub’s gradual transformation into a full governance and security intelligence platform, not just a repository hosting service. The emphasis is shifting from passive rule enforcement to active insight generation and operational intelligence.
Fact Checker Results
GitHub confirmed these features are in public preview ✅
Rule insights dashboard integrates directly into repository settings structure ✅
Unified filter bar replaces older inconsistent dropdown filtering systems ❌
Prediction
GitHub will likely expand rule insights into predictive security analytics over time.
Future updates may include automated anomaly detection for bypass activity spikes.
Unified filtering may evolve into a cross-platform security query language for enterprise-wide governance.
🕵️📝✔️Let’s dive deep and fact‑check.
References:
Reported By: github.blog
Extra Source Hub (Possible Sources for article):
https://stackoverflow.com
Wikipedia
OpenAi & Undercode AI
Image Source:
Unsplash
Undercode AI DI v2
Bing
🔐JOIN OUR CYBER WORLD [ CVE News • HackMonitor • UndercodeNews ]
📢 Follow UndercodeNews & Stay Tuned:
𝕏 formerly Twitter 🐦 | @ Threads | 🔗 Linkedin | 🦋BlueSky | 🐘Mastodon


