
Listen to this Post
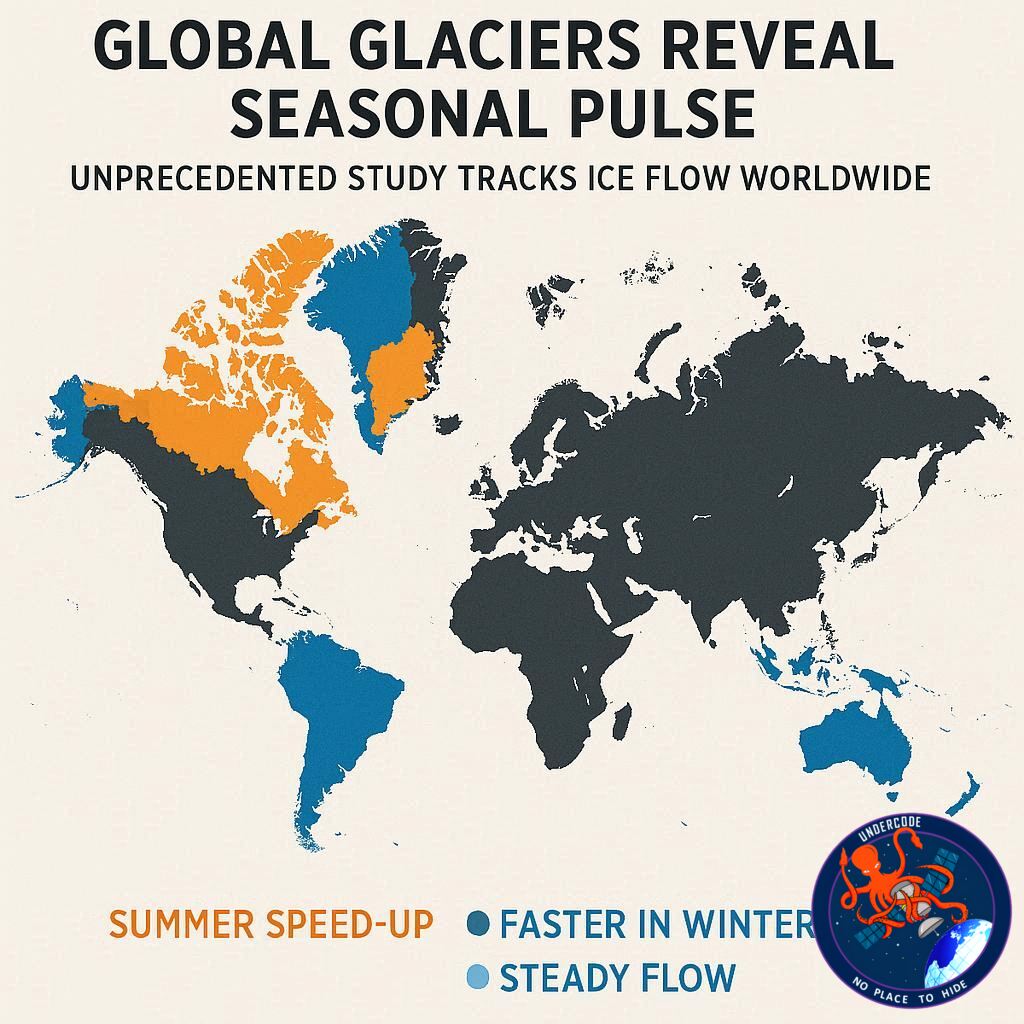
For the first time in history, scientists have created a comprehensive global map of how glaciers around the world speed up and slow down with the seasons. This groundbreaking research, published in Science in November 2025, analyzed over 36 million satellite image pairs—including decades of Landsat data—to capture the seasonal “heartbeat” of nearly every major glacier on Earth. Beyond mapping ice movement, the study reveals how climate change is intensifying these seasonal shifts, offering new insights into the planet’s evolving cryosphere.
The research leverages NASA’s ITS_LIVE ice velocity dataset from the Jet Propulsion Laboratory (JPL), combining optical Landsat imagery with radar data to create a complete picture of glacier dynamics. Scientists found that seasonal variations are strongest where annual maximum temperatures exceed freezing, highlighting the growing influence of warming on ice flow. By examining glaciers globally, researchers can now identify how factors such as geology, hydrology, and local climate interact to drive changes in glacier speed and melting patterns.
Alex Gardner, a NASA JPL scientist and co-author of the study, explained that combining Landsat and radar data was essential to tracking these subtle seasonal displacements. While previous studies often focused on individual glaciers or regions, this research uniquely applies a consistent global methodology, isolating universal drivers of seasonal glacier behavior.
Unveiling the Methodology
The team relied on Landsat satellites 4 through 9, alongside ESA’s Sentinel 1 (radar) and Sentinel 2 (optical) satellites. Landsat’s near-exact repeat orbits, nadir viewing angle, and stable instrument geometry allow for precise detection of surface shifts, crucial for tracking ice velocity. Feature tracking techniques focus on high-resolution panchromatic bands, enabling the measurement of subtle pixel movements over time. Older Landsat 4/5 images use the red band for maximum contrast on bright ice surfaces.
Radar imagery complements optical satellites by providing coverage regardless of daylight or clouds, while optical imagery excels in detecting flow during melt periods. By cross-validating these datasets, the team minimized uncertainty, using stationary surfaces like bedrock as controls.
Key Findings
The study confirms that glacier dynamics vary widely depending on location and glacier type. Meltwater lubrication, bedrock composition, fjord shape, and frontal melting all influence flow. Yet, the research identifies a universal pattern: seasonal variability surges when maximum annual temperatures exceed 0°C, and the amplitude of this seasonal cycle grows with each additional degree of warming.
Future incorporation of Landsat 9 data promises higher temporal revisit rates and spatial resolution, allowing more precise monitoring of glacier mechanics. The ITS_LIVE system is designed to adapt quickly to new sensors, ensuring that scientists can continue to refine our understanding of global ice flow.
What Undercode Say:
This study represents a pivotal leap in glaciology, moving from localized observations to a truly global understanding of glacier mechanics. By integrating decades of satellite data, the research establishes a benchmark for monitoring the impact of climate change on ice movement. One of the most compelling insights is the temperature threshold of 0°C for seasonal acceleration—a clear warning that even small increases in warming can dramatically affect ice flow.
The methodology itself—combining optical and radar imagery with high-resolution feature tracking—sets a new standard for remote sensing studies. By validating velocities against stationary surfaces, the researchers have quantified uncertainties more rigorously than prior work, enhancing confidence in global comparisons.
From a practical perspective, this data opens avenues for predictive modeling. Understanding how glaciers respond seasonally to warming can inform sea-level rise projections, water resource planning in glacier-fed regions, and hazard assessments for communities downstream of glaciers. The universality of the observed patterns suggests that even glaciers previously assumed stable may experience accelerated seasonal shifts as the climate warms.
Moreover, the study’s open dataset encourages collaboration and innovation across the scientific community. Researchers worldwide can now explore detailed ice dynamics at scales that were previously impossible, potentially uncovering mechanisms of glacier flow, meltwater interactions, and subglacial hydrology that have been long theorized but rarely observed directly.
Ultimately, this research underscores the interconnectedness of global systems. Glaciers are not just isolated ice masses—they are dynamic responders to climate, geography, and hydrology, with changes that resonate across ecosystems and human societies alike. The amplified seasonal fluctuations captured here are both a scientific breakthrough and a climate warning, emphasizing that the cryosphere is more sensitive to warming than previously understood.
Fact Checker Results:
✅ The study analyzed 36 million satellite image pairs, consistent with official Science publication details.
✅ Seasonal variability is indeed most pronounced where annual maximum temperatures exceed 0°C, as reported by NASA JPL.
✅ The ITS_LIVE dataset integrates both Landsat and radar imagery, matching the methodology described.
Prediction:
🌡 As global temperatures rise, glaciers worldwide will experience increasingly pronounced seasonal pulses, potentially accelerating meltwater release and influencing sea-level rise more rapidly than current models predict.
❄ This dataset will likely become a cornerstone for real-time glacier monitoring, enabling early warning systems for flood risks in glacier-fed rivers.
🌍 In the next decade, combining Landsat 9 and next-generation satellites could allow near-continuous global tracking of ice dynamics, revealing regional anomalies and unexpected glacier responses previously unseen.
🕵️📝✔️Let’s dive deep and fact‑check.
References:
Reported By: science.nasa.gov
Extra Source Hub (Possible Sources for article):
https://www.stackexchange.com
Wikipedia
OpenAi & Undercode AI
Image Source:
Unsplash
Undercode AI DI v2
Bing
🔐JOIN OUR CYBER WORLD [ CVE News • HackMonitor • UndercodeNews ]
📢 Follow UndercodeNews & Stay Tuned:
𝕏 formerly Twitter 🐦 | @ Threads | 🔗 Linkedin | 🦋BlueSky | 🐘Mastodon


